Basic configuration
EXOMARS Simulator fundamental aim is to emulate the EXOMARS’ SPDS and RLS combined workings under laboratory conditions. With this, scientific and technical issues can be addressed and solved based on experiments made into the right framework.
The SPDS carrousel and the IOH focusing system in RLS are emulated with linear positioners (X and Z axis), assuming that the carrousel radius is big enough to be approached by a straight line. Furthermore, another axis (Y axis) was added to be able to address issues as collaborations with other instruments, in a smart mode configuration (which, at the moment, is not included in EXOMARS).
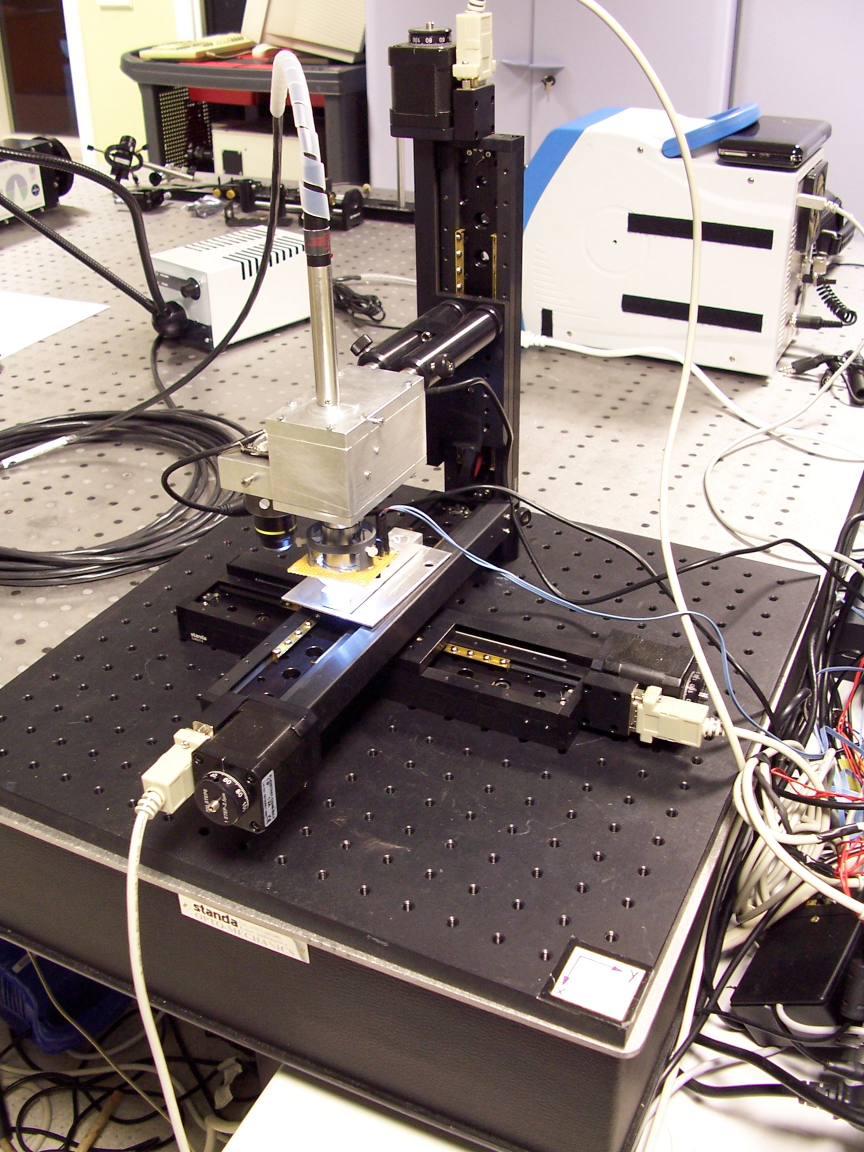
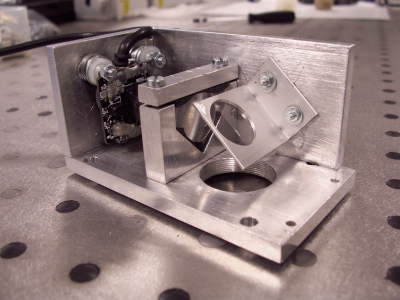
The basic configuration of the EXOMARS Simulator is an XYZ positioning system with an optical head attached to the Z axis, and a refillable container attached to the XY positioners. This way, a sample can be positioned under the optical head and be analysed.
Positioning
The positioners used for the X and Y axis, and for the Z axis offer a spatial resolution of 2.5 microns. They also give a very high repeatability and accuracy parameters.
Imaging
The optical head implemented in the EXOMARS simulator has two different objectives which can be positioned over the sample to allow making better studies of the sample.
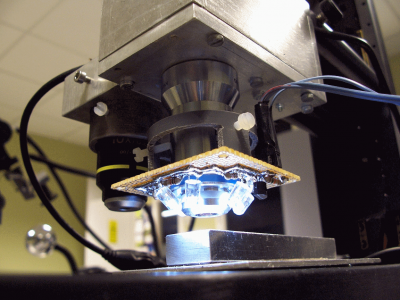
The first objective is a 10X/WD 7.0, which is used only for imaging purposes. With it, a wide field of the sample (1580 x 1185 microns) can be viewed and studied.
The second microscope objective used in the simulator is a 50X. It is used to see the sample in more detail in a smaller field of view (282.5 x 215 microns), but also to focus the laser onto the sample. This way it is possible to know exactly where the laser is hitting the sample. To do so, a beamsplitter in 45º configuration is used, allowing the raman probe and the camera to use the same objective to focus the sample. With this configuration, a spot size of 58 microns is obtained on the sample surface.
The cameras used in this layout are web cams, which have been disamssembled conveniently.
Spectra acquiring
To acquire Raman spectra, a control module for spectrometers and lasers was included in the EXOMARS Simulator software. The designed optical head allows the coupling of many different types of Raman probes to the simulator.
The software also includes a graphical representation chart to represent the acquired spectra.
Autofocus
In order to be able to operate in an automatic mode, a software based autofocusing algorithm has been merged into the Simulator software. Based on the images, this method, called ‘’Grey Level Variance’’, uses the grey level variance of a region of the image to decide whether the focusing level is better or not. This way, taking several images in different points, it will be possible to decide in which one of them the focusing level is better.
Variance is defined as, 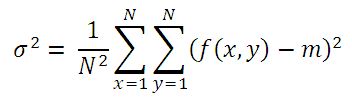 where ‘’m’’ is the mean of the distribution of the grey levels, ‘’f(x,y)’’ is the intensity of the grey level of the pixel in position ‘’(x,y)’’ and the selected squared focusing area has sides of ‘’N’’ pixels. The bigger the variance, the better focused the image.
For the simulator, this algorithm has been implemented using a focusing surface of 32 by 32 pixels, which is equivalent to about a 15 by 15 microns surface, in the center of the laser spot.
Smart Positioning
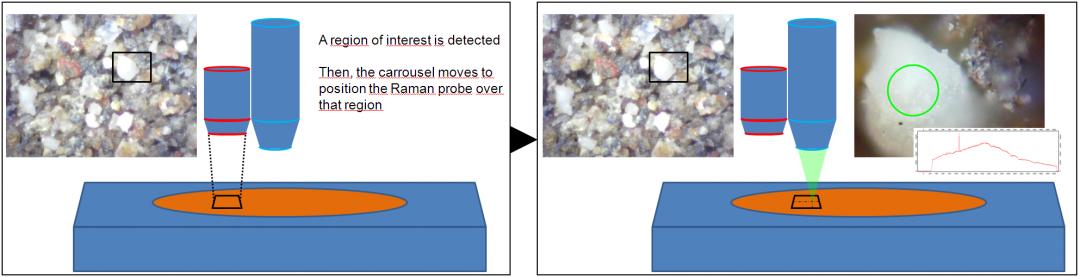
Having the simulator two different amplification cameras means that a smart scan of the sample can be made. Using the 10X objective it is easy to find an important spot which might be interesting for study, and the simulator software can put that very spot under the 50X objective simply by clicking it on the image.
Automatic Mode
The simulator software has been entirely developed at the Unidad Asociada UVA-CSIC-CAB. The automatic mode can be (re-)programmed to fit the exact needs of each concrete experiment, taking into account:
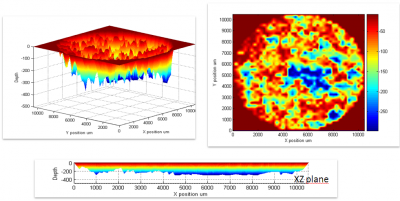
- Positioning: with the 2.5 microns resolution in all three axis, it is possible to make very good 3-D mappings of the samples, being able to study the relief of the sample in detail, as well as its mineralogical composition based on the raman spectra obtained.
- Autofocus: as it is needed, the autofocus can be used or not during the automatic process.
- Fluorescence elimination: if fluorescence is detected on the sample (by taking two consecutive spectra prior to the final spectrum acquisition) a fluorescence elimination algorithm can be included on the automatic mode.
- Acquisition Parameters Adjustment: An algorithm to adjust the acquisition parameters automatically has been implemented in the simulator, as an essential step for the simulator to work in automatic mode. Basically, based on a short time acquisition, it adjusts the Integration Time (Ti) to a value which cover most part of the dynamic range of the CCD, and then calculates the Accumulation Number (Na) to improve the SNR and to fit the maximum allowed time per spectrum. TotalTime = Ti x Na.
- Spectrum acquisition: the final acquisition of the spectra can also be made automatically, acquiring and subtracting dark spectra if desired.